Aligned Elements Web Client User Manual
3.1.272.24402
3.1.272.24402
  • Introduction
  • Basic Concepts
  • Get Started
    • Activate your Aligned Elements Account
    • Log In
    • Open a Project
    • Change Project
    • Create a new Project
    • The Project Start Site
    • Your Assigned Items
    • Manage Your User
    • Log Out
    • Enter Design Control Items
      • Work with Chapters
      • Work with Table Attributes
      • Inserting Images in Attributes
      • Working with Traces
      • Add Issues
      • Add Attachments
      • Collaborate using Comments
      • Favourites
      • Find in... Actions
      • Inconsistencies and Positive Cues
  • Document Object Actions
    • Move and Rearrange Chapters and Document Objects
    • Update Multiple Items
    • Generate Design Control Items
    • Copy Design Control Items
    • Lock Document Objects
    • Generate Reports
    • Export Document Objects
    • Import Document Objects
    • Copy Document Objects between Projects
    • Import Files
  • Explorers and Views
    • Project Explorer
    • File Explorer
    • Trace Explorer
    • Test Run Explorer
    • Project History
    • Chapter View
    • List View
    • Search Result View
    • Export to Excel in Grids
  • Project Status
    • Display Inconsistencies
    • Display Consistency Coverage
    • Display Risk Summary
    • Display DHF Index
  • Queries
    • Run a Query
    • Design a Query
    • Query Filters
  • Charts
    • Display a Chart
    • Design a Chart
  • Trace Tables
    • Run a Trace Table
    • Design a Trace Table
  • Work with Documents
    • Adding Word Document to File Objects
    • The Word Add-in. Adding Design Control Items to Documents
    • Sign Documents with Electronic Signatures
    • Save Files to Disk
    • Released Document View
  • Design Reviews
    • Conduct a Design Review
  • Risk Analysis
    • Perform a FMEA Risk Assessment
    • Perform a Preliminary Hazard Analysis
    • Relative vs. Absolute Mitigations
    • Potential Hazard
    • Using the Risk Analysis to assess the Software Safety Classification
  • Manage Tests
    • Test Runs
      • Planning a Test Run
        • The Burndown Chart
      • Executing a Test Run
      • Completing a Test Run
      • Test Run Functions
      • Test Runs and Linked Projects
      • Caching of Test Runs and Test Run Explorer
    • Classic Tests
  • Work with Tags
    • Add Tags
    • Filter views on Tags
    • Edit Tags
    • Tags and Snapshots
  • Assistants
    • Run an Assistant
  • Snapshots
    • Create a Snapshot
    • Display a Snapshot
    • Compare Snapshots
  • Settings
    • Project Information
    • Manage Users
    • Manage User Groups
    • Project Settings
    • Project Hierarchy
      • Branch Projects
      • Merge Projects
    • Unlock Objects
  • Dashboards
    • Select a Dashboard
    • Create a Dashboard
    • Remove a Dashboard
  • AI Features
    • AI Features in Aligned Elements
  • Aligned Elements Automation Tool
    • The Automation Tool
  • Web Administrator Tools
    • Manage Projects
    • Rename, Copy or Remove Project
    • Manage Users
    • Manage Permissions
    • Register a new Administrator
    • Inspect User Logs
    • Manage Templates
    • Download Log Files
  • Manage Service Configuration
  • Configure a Type Name Change
Powered by GitBook
On this page
  • How to display a Chart
  • Export a Chart
  • Import a Chart
  1. Charts

Display a Chart

PreviousQuery FiltersNextDesign a Chart

Last updated 1 month ago

Aligned Elements can display breakdown charts on a selected set of Document Objects.

In Aligned Element, you can add Charts, modify, copy, rename, and delete them. A chart essentially consists of:

  • an input set of Document Objects

  • a number of chart properties

These two in combination yield a Chart to be displayed. Charts can be performed on current Document Objects in the master project and the linked projects.

Note! Objects from snapshots or from older revisions cannot be included in a Chart.

How to display a Chart

In the Navigation Bar entry Charts, select the type name for the Chart. In the next view, the left side will display a list of available charts of the type name.

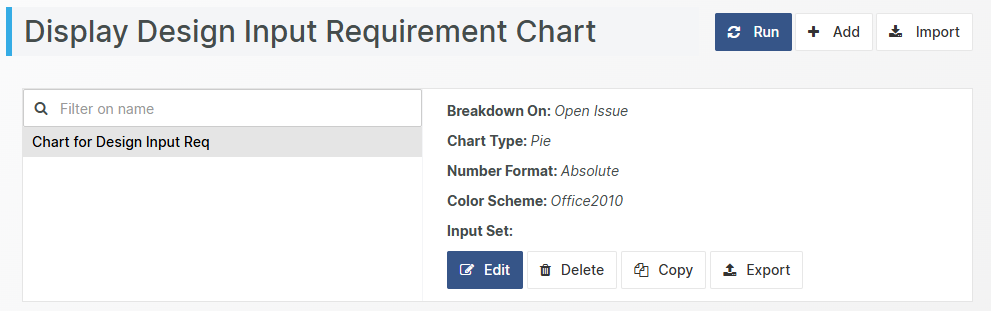
Selecting a chart name will display the chart definition of the chart on the right side.

To display the actual chart, click Run.

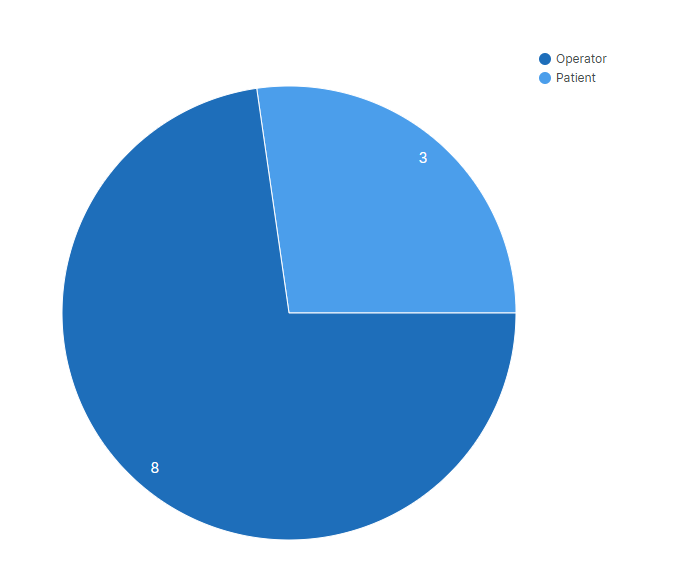
In the displayed chart, click on a chart section (a bar, slice, or column) to display all Document Objects of the section in a list below the Chart.

Export a Chart

Select a Chart and click Export to export the Chart definition to an xml file. The xml can be used to import the chart in other Projects.

Note! The exported file contains the definition of the chart, not the items in the input set or the chart image.

Import a Chart

Click Import to select an exported Chart xml definition file and import it. If necessary, adapt the Chart input set after the import is completed.